


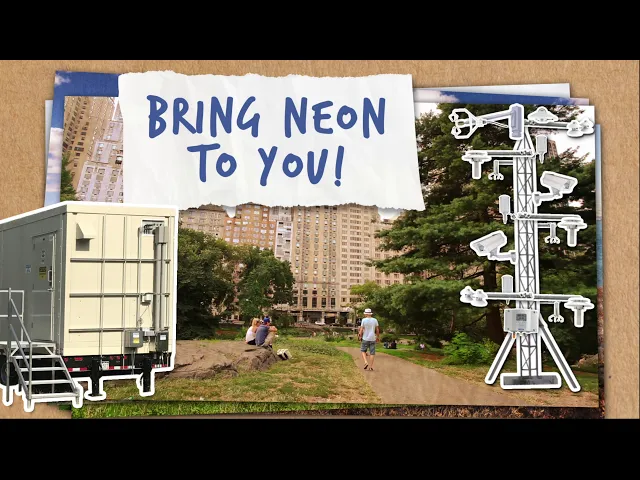
Innovations in Climate Resilience - Motion design for Times Square — built to stop people mid-stride and spark conversation around climate solutions

Season Spotter - Animated logo design for layover on on social media videos, endcards, graphics and web applications

NEON Training Animated Intro - Intro graphic for NEON training and tutorial videos rooted firmly in NEON brand standards
Ideas in Motion
13+ years of motion design, illustration, and video production — taking what's complex, intricate, and hard to explain and making it move.
Ecological Forecasting - Attempts to predict environmental conditions based on interactions between organisms and their environment
NEON for All - NEON collects and provides long-term open access ecological data and samples to better understand how U.S. ecosystems are changing
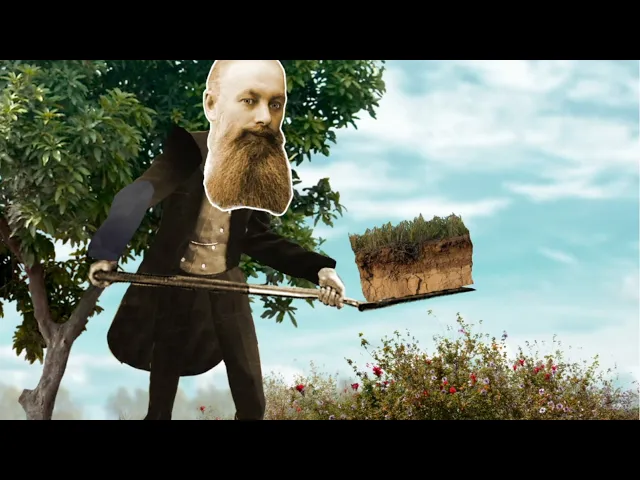
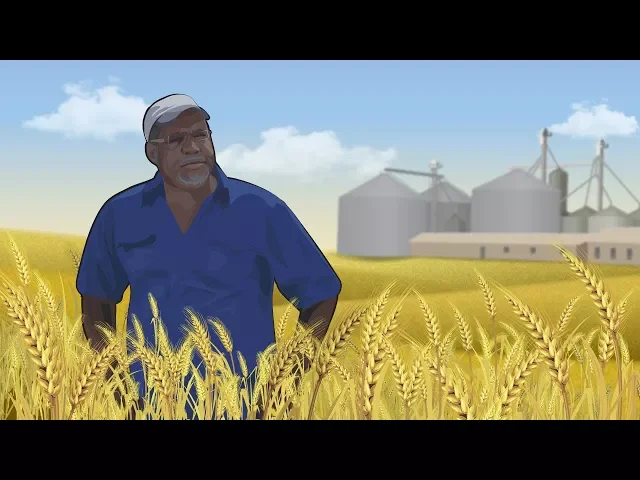
Digging Up Dirt on Soil Carbon - Measuring soil carbon stores and exchanges is critical in providing data to predict future soil carbon concentrations


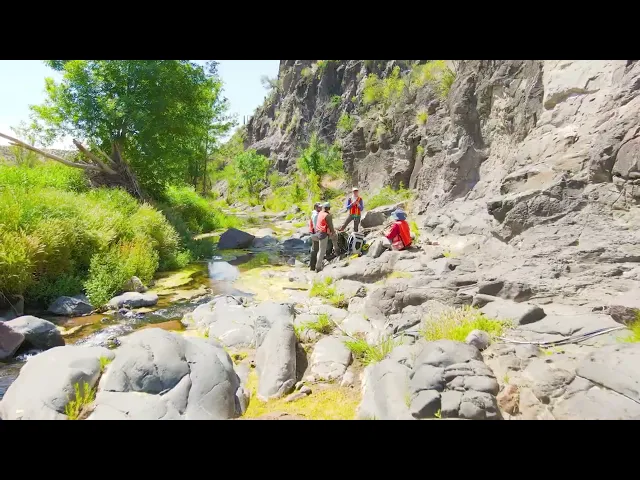
Sycamore Creek NEON Aquatic Field Site -Conceptualized and led drone cinematography for a flagship field site profile
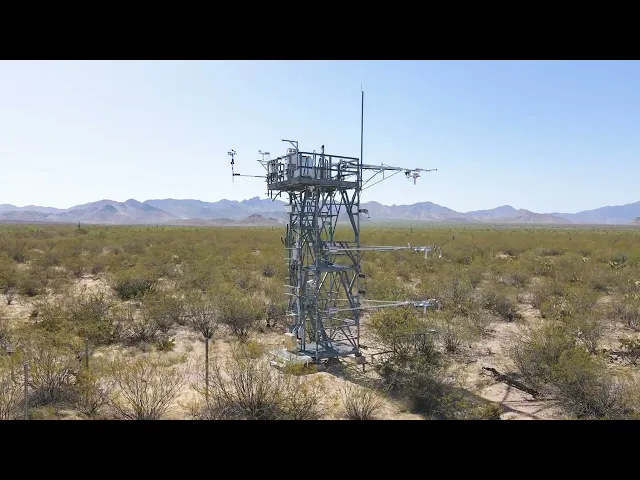
Santa Rita Experimental Range NEON Terrestrial Field Site - Conceptualized and led drone cinematography for a flagship field site profile
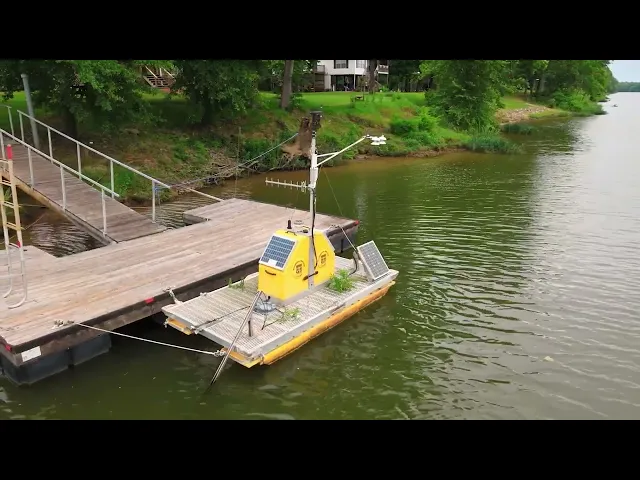
Black Warrior River NEON Aquatic Field Site - Conceptualized and led drone cinematography for a flagship field site profile
Complexity, Clarified
Leading the full lifecycle of video production from concept to final frame, I build motion that makes the complicated feel inevitable.
NEON for All - NEON collects and provides long-term open access ecological data and samples to better understand how U.S. ecosystems are changing
Ecological Forecasting Challenge - Motion, video, and sound converge in this call to action — inviting researchers to submit their forecasts
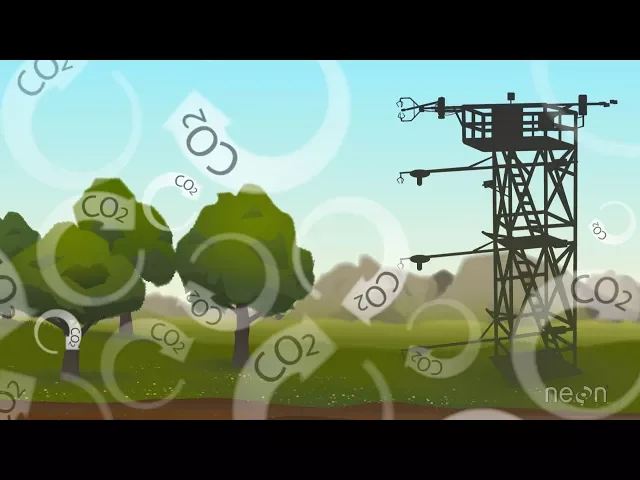
Eddy Covariance - A motion-driven explainer breaking down one of ecology's most complex measurement processes

90 years of Battelle - A short format video highlighting accomplishments and successes at Battelle, a major federal science contractor
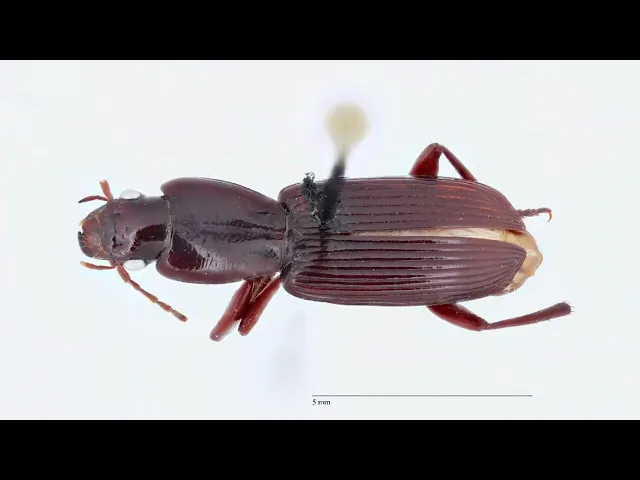
Lifecycle of a NEON Sample - sampling that allows for greater understanding of complex ecological processes at multiple scales
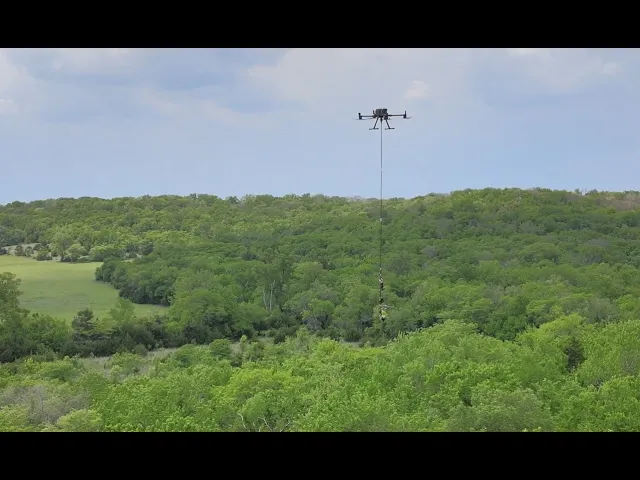
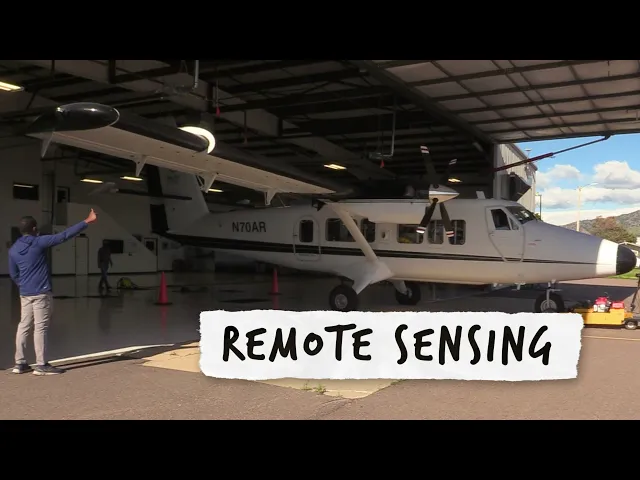
A Drone Based Approach to Collecting Sunlit Canopy Samples - exploring ways to integrate drones into ongoing ecological research


